
Views: 0 Author: Site Editor Publish Time: 2026-11-11 Origin: Site


Depth of Discharge (DoD) stands out as the most critical yet frequently misunderstood specification influencing the return on investment of energy storage. Many commercial decision-makers wrongly assume buying a 500kWh battery means having 500kWh of daily usable energy. This misconception creates significant financial risk. Failing to account for optimal DoD directly leads to severe system under-sizing. It also causes unexpected operational failures and often voids manufacturer warranties.
This article bridges the gap between complex engineering specifications and practical commercial decision-making. We provide a clear framework for evaluating usable capacity and calculating long-term lifecycle costs. You will learn how to navigate complex vendor datasheets accurately. We also explain how to align system sizing with your facility’s actual daily load profile. By mastering these concepts, you ensure your battery assets deliver reliable power without suffering premature degradation.
Nameplate vs. Usable Capacity: A battery's rated capacity is distinct from its usable capacity, which is governed by the manufacturer's recommended DoD limit (often 80% to 95%).
The Cycle Life Trade-Off: Consistently discharging a battery to 100% accelerates cell degradation; limiting DoD extends the asset’s operational lifespan and maximizes total energy throughput.
Chemistry Matters: Modern LiFePO4 battery storage supports safely cycling at a much higher DoD (typically 90%+) compared to legacy chemistries, fundamentally changing project economics.
Warranty Compliance: Exceeding software-defined DoD limits can void manufacturer warranties, making the Battery Management System (BMS) a critical component in risk mitigation.
To evaluate a Commercial Battery Energy Storage System effectively, buyers must understand exactly what Depth of Discharge represents. Conceptually, DoD defines the percentage of a battery's total capacity discharged relative to its overall nameplate capacity. Industry professionals often contrast DoD directly against State of Charge (SoC). These two metrics represent inverses of one another. If a battery has discharged 80% of its total capacity, its DoD reaches 80%. Consequently, the remaining State of Charge sits at 20%.
Think of DoD using a standard fuel tank analogy. While a vehicle might possess a 20-gallon fuel tank, drivers rarely consume every single drop before refueling. Running the tank completely dry introduces debris into the engine and leaves the driver stranded. Battery cells operate under a similar principle. The bottom 5% to 10% of a battery's capacity often remains intentionally locked. Manufacturers restrict access to this bottom tier to prevent permanent electrochemical damage to the cells. Therefore, the nameplate capacity represents the absolute physical size of the tank, while the usable capacity represents the fuel you can actually burn daily.
This distinction carries profound Capital Expenditure (CAPEX) implications. Many procurement teams mistakenly evaluate energy storage strictly on a "cost per nameplate kWh" basis. This metric proves fundamentally flawed. If you buy a cheaper battery but can only cycle it to 60% DoD, you pay a massive premium for unused capacity. Smart commercial decisions must center on "cost per usable kWh." Evaluating assets based on their functional daily yield reveals the true upfront cost of an energy storage investment.
Pushing a battery to its absolute limits creates significant physical consequences inside the cell. We refer to this as the physics of degradation. Deeper discharges subject battery internal structures to higher thermal and mechanical stress. When lithium ions move back and forth between the anode and cathode, the structural volume expands and contracts. Discharging completely to 100% DoD maximizes this physical strain. Over time, this extreme movement thickens the Solid Electrolyte Interphase (SEI) layer. A thicker SEI layer traps active lithium ions, leading directly to irreversible capacity fade.
Evaluating degradation curves helps project developers visualize this trade-off clearly. Manufacturers plot expected cycle life against various DoD parameters. A standard commercial system might offer 6,000 cycles when discharged strictly to an 80% DoD limit daily. However, if operators push that exact same hardware to 100% DoD, the expected cycle life often plummets to 3,500 cycles. Gaining 20% more energy today sacrifices nearly half of the asset’s overall operational lifespan.
Procurement teams must incorporate these degradation curves into their financial modeling. Specifically, buyers should calculate the Levelized Cost of Storage (LCOS). This formula balances daily energy availability against replacement frequency. Higher DoD yields more energy for daily peak shaving or load shifting, which improves immediate monthly savings. However, a shorter cycle life means the facility must replace the battery modules years earlier than anticipated. Optimizing the LCOS requires finding the perfect mathematical intersection where daily energy yield maximizes revenue without triggering premature hardware replacement.
Always request a project-specific degradation curve from your vendor based on your actual daily load profile.
Model hardware replacement costs into year 7 or year 10 of your pro forma if you plan to run aggressive DoD parameters.
Factor in the revenue lost during the system downtime required for cell replacement.
Not all battery chemistries handle deep discharges equally. Legacy benchmarks provide a helpful contrast for modern capabilities. Traditional lead-acid batteries remain strictly limited to a 50% DoD operational ceiling. Pushing lead-acid beyond this halfway mark permanently damages the internal lead plates through heavy sulfation. Similarly, Nickel Manganese Cobalt (NMC) chemistries typically cap at an 80% DoD limit for commercial viability. NMC offers high energy density, but deep cycling accelerates its degradation rate significantly.
This performance gap explains why Lithium Iron Phosphate (LFP) has rapidly become the industry standard for commercial applications. Modern LFP cells frequently allow for 90% to 95% DoD without severe degradation penalties. The robust crystal structure of iron phosphate withstands the mechanical stress of lithium-ion insertion far better than legacy alternatives. This chemical stability fundamentally changes project economics. Facility managers can utilize almost the entire battery footprint daily without fear of destroying the asset.
Furthermore, safety and thermal stability remain paramount in commercial installations. Pushing higher DoD cycles generates internal heat. In NMC systems, this heat can occasionally trigger thermal runaway, a dangerous chain reaction leading to severe fires. LFP systems inherently resist thermal runaway even under high-stress, deep-discharge conditions. This superior thermal profile aligns perfectly with stringent commercial fire safety compliance, reducing insurance premiums and easing the permitting process.
Table: Typical Depth of Discharge Limits by Battery Chemistry
Battery Chemistry | Standard DoD Limit | Estimated Cycle Life (at standard DoD) | Primary Commercial Viability |
|---|---|---|---|
Lead-Acid | 50% | 500 - 1,000 Cycles | Low (Legacy Backup only) |
Nickel Manganese Cobalt (NMC) | 80% | 2,000 - 4,000 Cycles | Medium (EVs and Space-Constrained sites) |
Lithium Iron Phosphate (LFP) | 90% - 95% | 6,000 - 8,000+ Cycles | High (Standard for C&I Storage) |
Transitioning from chemical theory to field deployment requires precise mathematics. Engineers rely on a standard sizing formula to prevent system failures. You must divide your target daily load by the manufacturer's recommended DoD limit to determine the required nameplate capacity. Relying on simple one-to-one matching guarantees failure during peak demand events.
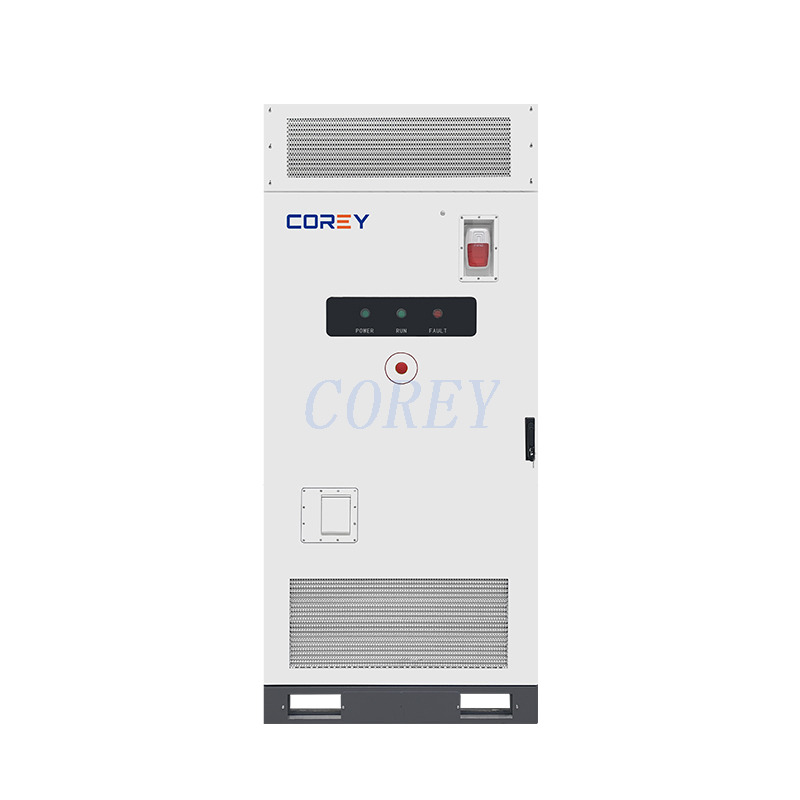
Consider a real-world application using a 261kWh BESS as our evaluation baseline. Imagine a manufacturing facility requiring exactly 250kWh of backup power to sustain operations through an evening peak pricing window. If the facility manager buys a generic 261kWh system with a strict 80% DoD limit, the system yields only about 208kWh of usable energy. This represents a severely undersized solution. The facility will run out of power 40kWh short of its operational target, resulting in costly grid demand charges.
Conversely, choosing a premium system changes the outcome completely. A modern 261kWh cabinet utilizing advanced LFP cells at a 95% DoD yields approximately 247kWh. While still cutting it close, this configuration dramatically shifts the usable energy metric, meeting most project thresholds without requiring the purchase of a second cabinet. Understanding this nuance saves hundreds of thousands of dollars in oversized equipment purchases.
However, sizing must also account for future-proofing and capacity fade. Batteries degrade naturally over time regardless of how carefully you manage them. Smart buyers shortlist vendors based on their End-of-Life (EOL) capacity guarantees. If a vendor guarantees 70% retained capacity at year 10, your system will shrink over the decade. We strongly recommend sizing a capacity buffer upfront. Ensure your system still meets your facility's daily load requirements in year 10, despite natural degradation, rather than only meeting day-one requirements.
Navigating the procurement phase requires extreme vigilance regarding warranty language. Manufacturers rarely offer blanket operational guarantees. Instead, they structure warranties around strict "Energy Throughput" limits and rigid DoD operational ceilings. Energy throughput measures the total megawatt-hours (MWh) discharged over the asset's life. If you exceed the daily DoD limit, you consume your throughput allowance prematurely. Exceeding these limits gives manufacturers legal grounds to deny replacement claims when cells degrade faster than expected.
The Battery Management System (BMS) acts as the ultimate enforcer of these warranty terms. The BMS serves as the brain of the storage system, monitoring cell voltage, temperature, and cycle depth. Crucially, the BMS enforces a "hard stop" at the bottom of the discharge cycle. If a vendor aggressively advertises "100% DoD capability," buyers must ask a critical technical question. Verify whether this represents 100% of the physical cell capacity, or 100% of a software-gated usable capacity. Reputable integrators lock away the bottom 5% via BMS software, allowing the user to discharge 100% of the remaining allocated energy safely.
To mitigate risk and protect your investment, follow these structured procurement steps before signing any vendor contract:
Request complete warranty documentation: Do this prior to purchase. Look for hidden clauses regarding cycle limits, operating temperatures, and DoD maximums.
Demand projected degradation curves: Ask integrators to provide tailored models based on your specific daily cycling profile, not just laboratory ideal conditions.
Verify BMS configurability: Ensure you can adjust operational parameters. Check if the system includes remote monitoring capabilities. Cloud-based monitoring provides irrefutable data logs to prove warranty compliance if disputes arise.
Evaluate the integrator's track record: A strong warranty holds no value if the manufacturer goes bankrupt in year four. Stick to established tier-one suppliers.
Depth of Discharge serves as the fundamental balancing act at the heart of every commercial storage deployment. Maximizing daily operational capacity offers immediate financial benefits, but it directly competes with the goal of extending asset longevity. Understanding this tension allows facility managers and financial officers to model long-term performance accurately. Ignoring DoD realities guarantees undersized systems, frustrated operational teams, and poor financial returns.
We urge commercial buyers to permanently shift their primary evaluation criteria. Stop measuring value based on nameplate capacity. Instead, focus entirely on warrantied usable capacity calculated over a 10-to-15-year lifecycle. This shift in perspective aligns procurement costs with actual operational performance.
Before issuing a final Request for Proposal (RFP), take time to review your facility's exact load profile. Outline your peak demand spikes and duration requirements clearly. Then, consult directly with an integration specialist to model precise DoD requirements. Proper upfront modeling transforms energy storage from a risky hardware purchase into a highly predictable, revenue-generating asset.
A: Technically yes, but commercially no. Occasional 100% discharges during severe grid outages remain acceptable for emergency operations. However, daily cycling at a true 100% DoD accelerates cell degradation exponentially. Implementing this aggressive strategy will often void standard operational warranties from the manufacturer. It is always safer to operate within a 90% to 95% limit for LFP systems.
A: They act as exact inverses of one another. A battery resting at a full 100% SoC currently has a 0% DoD. If a facility discharges 80% of the battery's energy (reaching an 80% DoD), the remaining SoC automatically drops to 20%. Together, they always equal the total usable capacity currently allowed by the software.
A: LFP chemistry features a highly robust crystal structure that remains inherently stable under intense mechanical and thermal stress. This chemical stability allows LFP cells to sustain deeper, more frequent discharges safely. Consequently, LFP experiences a significantly lower rate of irreversible capacity fade compared to NMC chemistries under the exact same deep-cycle conditions.


